Prefer to study in Korean? 👉 [ 한국어로 읽기 ]
Welcome back! 😊
In Part 4, we learned the TOPIK writing scoring criteria. Today we finally start TOPIK Question 53.
Question 53 has a graph and numbers, so it can look hard at first. But don’t worry. Question 53 is not a question where you write your own free opinion.
💡 Remember just this:
Question 53 asks you to look at the given data, pick only the important points, and describe them in 200–300 characters. You describe the data, not your opinion.
1. What Is TOPIK Question 53?
| Question 53 | |
|---|---|
| Points | 30 |
| Length | 200–300 characters |
| You write | a text that describes the data (graph/chart) |
| You don’t write | a title, or your free opinion |
2. Let’s look at a real question (60th test)
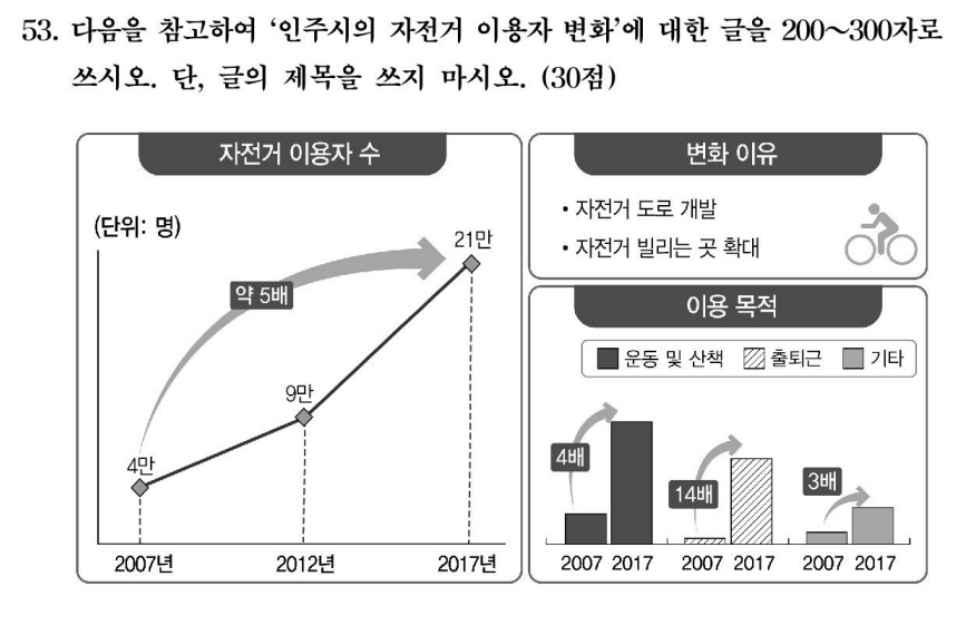
The prompt begins like this:
다음을 참고하여 ‘인주시의 자전거 이용자 변화’에 대한 글을 200~300자로 쓰십시오. 단, 글의 제목을 쓰지 마십시오.
Write about “the change in bicycle users in Inju City” in 200–300 characters. Do not write a title.
The first thing to look at is not the graph — it’s the TOPIC.
주제 = ‘인주시의 자전거 이용자 변화’
Topic = the change in bicycle users in Inju City
So we write only about this topic. Don’t write your own story like “저는 자전거를 좋아합니다”
3. Break the data into 3 parts
Looking at the whole graph and writing right away is hard. First split it, and find just one key point in each part.
| Data | What you see | The key point |
|---|---|---|
| ① 자전거 이용자 수 | 2007년 4만 → 2012년 9만 → 2017년 21만 명 | 약 5배 늘었다 |
| ② 변화 이유 | 자전거 도로 개발 / 빌리는 곳 확대 | 이유 두 가지 |
| ③ 이용 목적 | 운동·산책 4배 / 출퇴근 14배 / 기타 3배 | 출퇴근이 14배로 가장 많이 늘었다 |
You don’t write every number. Just catch the biggest feature of each part.
4. See how those 3 parts become a real answer
Here is a real model answer for this question (299 characters). Notice how the three parts of the data simply become sentences — nothing extra is added.
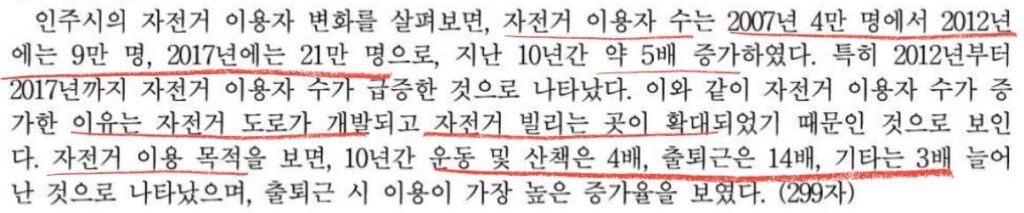
👉 Here is how each data part appears in the answer
인주시의 자전거 이용자 변화를 살펴보면, 자전거 이용자 수는 2007년 4만 명에서 2012년에는 9만 명, 2017년에는 21만 명으로, 지난 10년간 약 5배 증가하였다. 특히 2012년부터 2017년까지 자전거 이용자 수가 급증한 것으로 나타났다. 이와 같이 자전거 이용자 수가 증가한 이유는 자전거 도로가 개발되고 자전거 빌리는 곳이 확대되었기 때문인 것으로 보인다. 자전거 이용 목적을 보면, 10년간 운동 및 산책은 4배, 출퇴근은 14배, 기타는 3배 늘어난 것으로 나타났으며, 출퇴근 시 이용이 가장 높은 증가율을 보였다.
| Data part | In the model answer |
|---|---|
| ① 자전거 이용자 수 | “…2007년 4만 명 … 2017년 21만 명 … 약 5배 증가하였다” |
| ② 변화 이유 | “…자전거 도로가 개발되고 자전거 빌리는 곳이 확대되었기 때문…” |
| ③ 이용 목적 | “…운동 및 산책은 4배, 출퇴근은 14배 … 출퇴근 시 이용이 가장 높은 증가율…” |
Three quick things to notice:
✅ It follows the order: overall change → reason → purpose.
✅ Every sentence ends in written style (증가하였다, 보인다, 나타났으며) — no “-요/-습니다”.
✅ It is 299 characters — right inside 200–300. It picks the key points and adds nothing from outside the data.
5. Five things to be careful about
① Write the data, not your opinion. (I like bicycles ❌)
② Don’t write every number — only the key features. (about 5×, commuting 14×)
③ Don’t write anything not in the data. (e.g., “because of health” — not in the data ❌)
④ Don’t write a title. Start with the body.
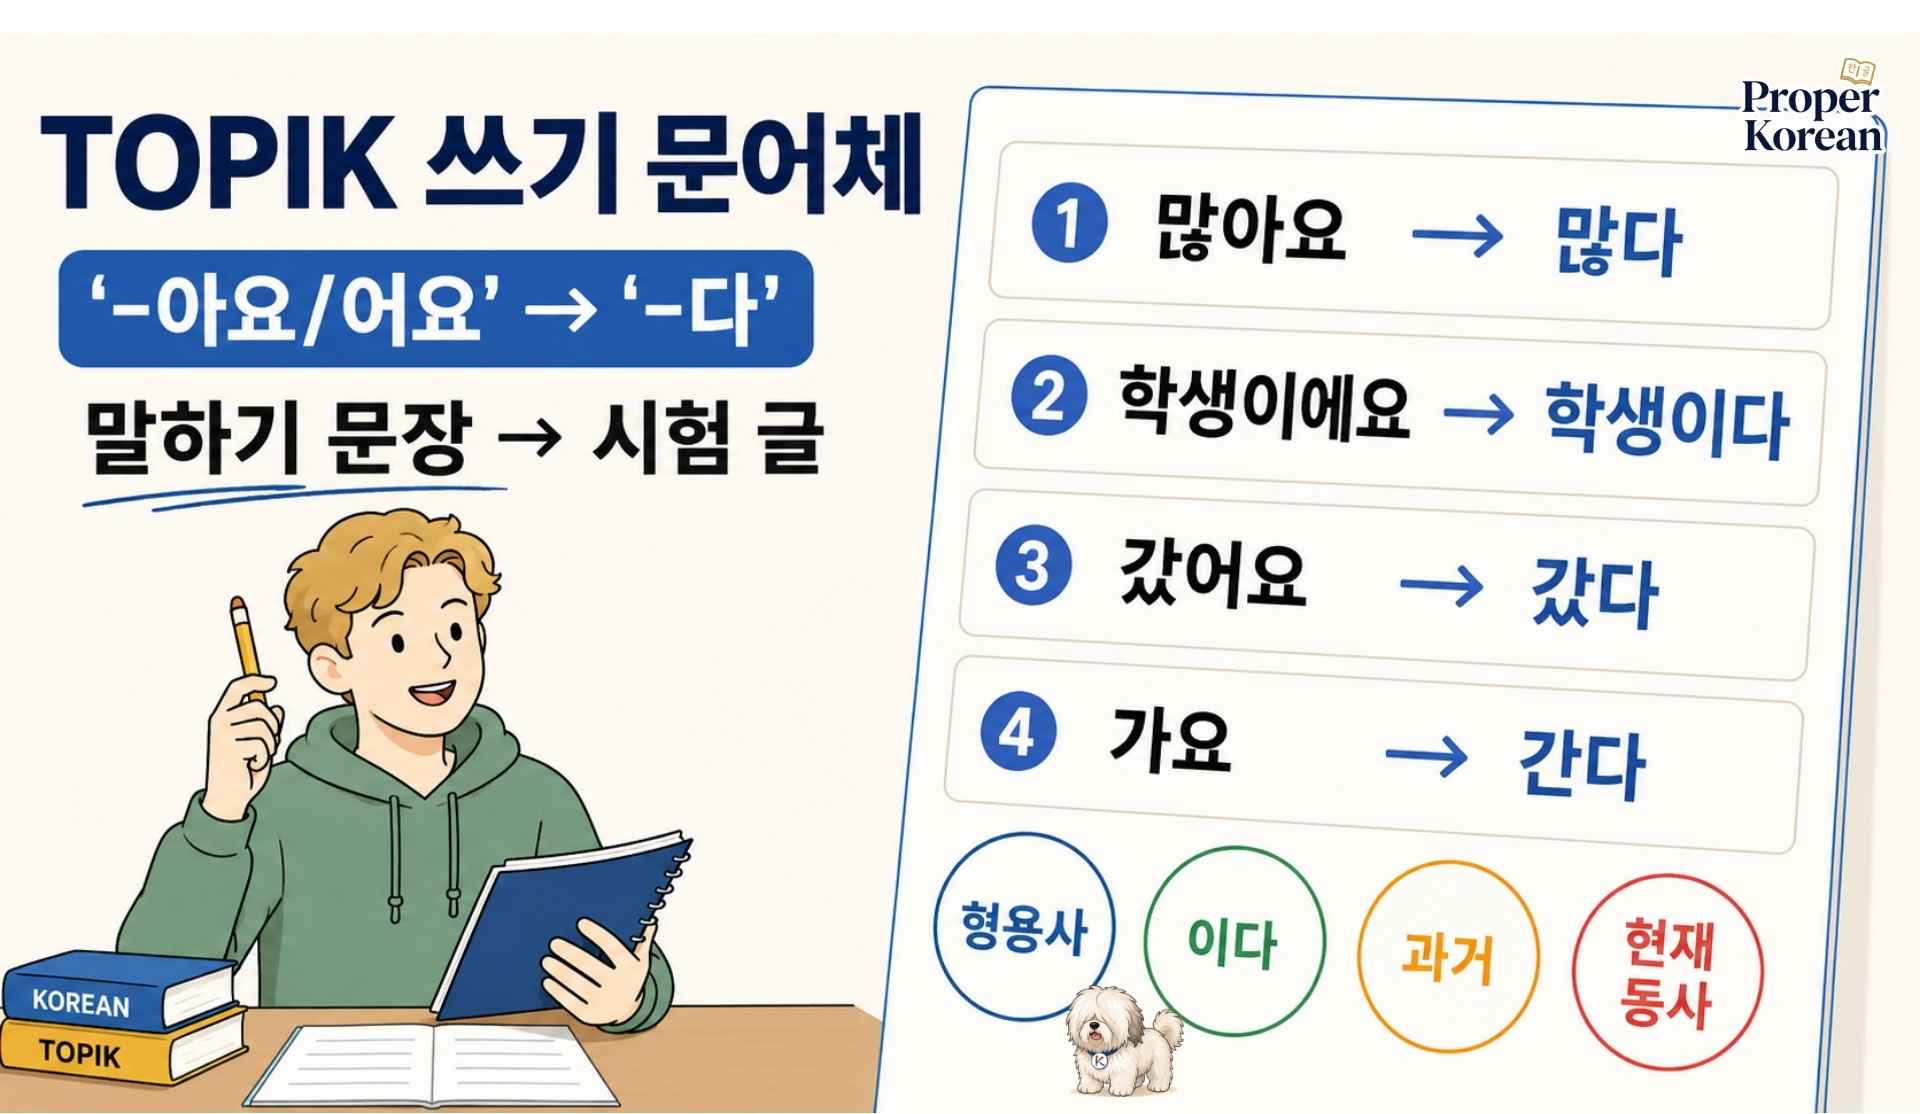
⑤ Use written style “-다,” not speaking style. (늘었어요 ❌ → 늘었다 ✅)
And remember from Part 4: graders check content, structure, and language — did you write on topic, in order, and in accurate written style? (For more details on grading 👉 Part 4)
6. Today’s practice — just read the data
You don’t need to write 200–300 characters yet. Just look at the graph and answer the six questions below in written style (“-다”). Click each one to check.
1. 이 문제의 주제는 무엇인가요?
🔽 See the answer
Q: What is the topic of this question?A:이 문제의 주제는 인주시의 자전거 이용자 변화이다.
The topic is the change in bicycle users in Inju City.
2. 2007년 자전거 이용자는 몇 명이었나요?
🔽 See the answer
Q: How many bicycle users were there in 2007?A:2007년에는 4만 명이었다.
There were 40,000 in 2007.
3. 2017년에는 몇 명이었나요?
🔽 See the answer
Q: How many were there in 2017?A:2017년에는 21만 명이었다.
There were 210,000 in 2017.
4. 약 몇 배 늘었나요?
🔽 See the answer
Q: About how many times did it increase?A:약 5배 늘었다.
It increased about 5 times.
5. 변화 이유는 무엇인가요?
🔽 See the answer
Q: What are the reasons for the change?A:변화 이유는 자전거 도로 개발과 자전거 빌리는 곳 확대이다.
The reasons are new bike roads and more rental places.
6.이용 목적 중 가장 많이 늘어난 것은?
🔽 See the answer
Q: Which purpose of use increased the most?A: 출퇴근 목적이 가장 많이 늘었다. Commuting increased the most.
Summary 🌱
Question 53 asks you to describe the given data in 200–300 characters — not your own opinion.
Look at the topic first → split the data into 3 parts → pick only the key feature of each → don’t add outside info or a title → write in written style “-다”.
Don’t try to finish a full answer from the start. Begin by writing one accurate sentence from the data.
Next time, we learn the first training before writing Question 53: how to read a graph (marking it before you write).
See you in the next lesson!
🔎 Still finding levels 1–2 hard? Review the basics first 👉 [ TOPIK I study ]
❓ FAQ
Q: Can I write my own opinion in Question 53?
A: No. You describe the data. Only a very short summary at the end is okay.
Q: Do I have to write every number?
A: No. Pick only the key features (increased about 5×; commuting rose 14×).
Q: Do I write a title?
A: No. Question 53 has no title — start with the body.
Q: Can I write “늘었어요”?
A: No. Use the written style “늘었다.”
<Latest Posts>